When and How to use Google Analytics Annotations
Google Analytics Annotations are a built-in feature of Google Analytics. It lets all people with access to Google Analytics account add comments to nearly all reports (at least those with charts). Everybody should use annotations to comment on traffic changes, traffic spikes and other important events. This can save you a lot of time. You won’t have to do the same data dives every time you wonder why something happened to your traffic. It’s really useful when you’re looking at data from weeks, months or even years ago. Equally important, it saves your fellow analysts and coworkers for even more time, because they won’t have to do the deep dives at all. So in this post, I’ll teach you everything (or at least the most important) you need to know about annotations.
Why use annotations?
It’s all about documenting your data and saving a lot of time:
- Annotations save you and your coworkers time and let you avoid repetitive work as you won’t have to examine the same events more than once
- Annotations can document marketing activities and can work as a campaign log allowing you to more quickly determine the overall effect on traffic and conversions
- Annotations work as a better and collective memory than yours and provide a quick overview of events that might have had effect on your website traffic
Worth noting
There’s a couple of things you should know before you begin using Google Analytics annotations. And they’re also useful to know even if you’re already using them:
- By default, annotations are visible for all users with account access - they’re “Shared”. So if you add an annotation, it’ll be visible for all (unless you yourself do not have Collaborate access to the account). If you’d like to create an annotation just for you, then it’s possible to set it as “Private”
- Annotations are created on the View level. So when adding an annotation, it will not be visible in other views. On the other hand, if you add an annotation to a report in a specific view, it’ll be visible in other reports within the same view.
That’s pretty easy to understand, right? Now to the interesting stuff:
When to use Google Analytics annotations
As a rule thumb, always create an annotation when something that affects your traffic or conversions (either positively or negatively) which is out of the ordinary. What is ordinary, you ask? Well, on a typical retail website, you are likely to have high traffic on Mondays, which would graduately become lower over the week. Most types of websites experience some sort of ‘seasonality’ over a week, a month or even over a whole year. Some sites (like travel websites) have traffic and conversion peaks up to major holidays. It’s not necessarily just changes in traffic and conversions that should be annotated. If you make layout or navigation changes, you might also experience related changes on metrics such as Avg. Session Duration, Pages/Session etc. Some common examples of events that might need to be annotated are:
- Campaign bursts (newsletters, display campaigns, event TV or radio ads)
- Mentions on social media channels or in news that cause traffic spikes
- Changes to the website design, layout, navigation or checkout flow
- Technical issues where site performance is affected or where the site may be unavailable for some time
- Macro events such as weather, industry news, industry regulations etc.
- Competitor activity (what happens when a competitor launches a new product or campaign?)
- Changes to your Google Analytics configuration (such as filters)
Basically, it’s about keeping a journal of all events that have a major, sudden or unexpected effect on your metrics. It’s specially useful when comparing date ranges. In those cases you need to take into account, that there may be other factors than just time. For example, you might observe a low conversion rate in April 2016 compared to April 2015. But if you ran a free shipping campaign in April 2015 and you didn’t run the same campaign in April 2016. If you had made sure to add an annotation back in April 2015, you’d let yourself and others know why the conversion rate is different now - without anyone having to do the actual analysis again.
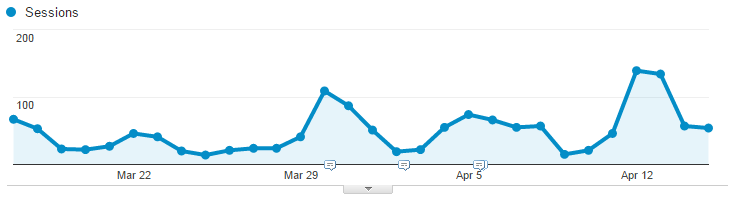
What do Google Analytics annotations look like?
Google Analytics Annotations are visible on the charts in most standard reports. You’ll be able to see them as small speech bubbles along the x-axis. They’ll appear on the dates they’ve been added to. You will also notice a small down-pointing arrow right on the middle of the x-axis:
If you click the arrow, you’ll see the expanded list of the actual annotations that have been created within the current date range. And you can also click a single speech bubble which will also expand the list, but will highlight that specific annotation:

The lists displays all annotations created in the current view. Also those added by other people with access to the view (unless they’ve been created as ‘Private’ annotations). By default, you’re able to see the date for which the annotation has been created, the actual annotation (or comment if you will), an Edit link allowing you to change date or text, and the email address of the user that added the annotation. It’s also possible to retrieve a complete list of all annotations, where you can search for specific annotations. This is useful when you’re looking for one or more specific annotations, but just can’t remember when they were created. Or if you want to get a list of all annotations e.g. describing technical website issues. Such a search is much easier if you make sure to use a naming convention for your annotations (i.e. a common and consistent way of writing your annotations). To find this list, simply go to Admin, select your View and select Annotations below the view dropdown selector.
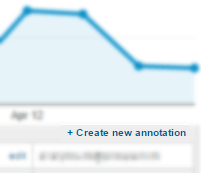
How to create an annotation
In most standard reports with charts, you’ll see the down-pointing arrow. Click that arrow to expand the Annotations panel. Besides from listing the existing annotations, you’ll be able to +Create a new annotation by clicking that link:
Then simply select a date, write your text and mark it as either Shared or Private - then Save, and that’s it!

An annotation can’t have more than 160 characters - something like a tweet. So they’re meant to be short and concise comments. The Visibility feature allows you to create private annotations that won’t be visible for other users than you.
Use naming conventions
So with 160 characters, it’s a requirement that you need to be very precise in a limited space. This can also make it difficult to accurately describe what you’re trying to describe. Which is why it’s very useful to have a certain way of writing those annotations. And you also have to consider that you might need to search for annotations a year from now. So don’t use abbreviations that you might forget, and always use the same way to describe similar events. E.g. use the word “Campaign” everytime you’re describing a campaign - or the word “Tech” when describing availability issues on the website. This is called a naming convention. To make one, you first have to decide what categories of events and annotations you’d want to use. And if those categories might have sub-categories. So for campaigns, your convention might look like this:
| Campaign type | Annotation text |
|---|---|
| Newsletters | Campaign: Newsletter: [Name of campaign] |
| Print ads | Campaign: Print: [Name of publication]: [Name of campaign] |
| Radio spots | Campaign: Radio: [Name of network]: [Name of campaign] |
With this naming strategy, it’ll always be easy to find annotations related to specific campaigns, or to print ads, or newsletters or publications/networks where you’ve placed ads. Similarly, you can define a strategy for technical events related to the website:
| Event | Annotation text |
|---|---|
| Releases | Tech: Release: [What was changed on the website?] |
| Downtime | Tech: Downtime: [When and why?] |
Who should write annotations?
Ideally, you’d have one or two people that are responsible for your Google Analytics annotations - including naming convention and actual creation. In practice, you might want to delegate certain categories of annotations to different people. The email marketing manager should create annotations related to newsletters, the release manager should create annotations for releases and downtime and so on. Alternatively, have people send you the information needed, and then create the annotations yourself. If you’re working with external agencies (such as media agencies, marketing agencies), just make sure that you have clear guidelines. If an agency creates filters, then decide beforehand how this should be annotated. Google Analytics annotations are just a great way to document all types of events. And it’s a time saver. Specially for accounts where many people have access.